This blog introduces an overview of monitoring SOA composites using Enterprise Manager Cloud Control 12 C.
1. Login enterprise manager console
2. Hit Targets-->Middleware
3. Hit Menu Middleware Features-->Application Dependency and Performance
4. In the Monitoring tab page, expend Oracle Enterprise Manager-->Composites-->default (SOA Partition)
You will see the composite list to show the deployed composites
5. Hit any composite link, it will goes to this composite summary page, that will give you the overview of the components, services and the references.
For example, we hit mobility composite
From the summary page, you can see the matrics for bpel process performance, mediator performance, SCA service performance and SCA Reference Performance.
You can get the performance matrics of Arrival, Completions, min and max Response Time.
6. Hit Service Tab, it shows web services name and WSDL URL of this composite.
7. Hit Reference Tab, it will shows all the references.
8. Hit Wires Tab, it will give you the wiring relationship between components and references in this composite with text view.
9. Hit Components tab, it will show bpel, mediator, decision services and human workflows in this composite.
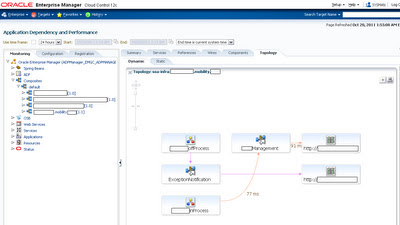
10. Hit Topology Tab
There are 2 views to show different topology for the composites: Dynamic Topology View and Static Topology View.
Click on Dynamic tab page, it will go to Dynamic Topology View, that shows all the dependency matrics between services, references and components in the composite based on invocation. In another word, it's invocation flow during runtime.
The lines in the graphic are showing the actual invocations.
Click Static tab page, we can see the static topology view of composites.
Static topology view shows all defined wires between services, references and components in the composites.
Using topology view, it could help us to understand the potential perforamnce issue on specific components.
12. Monitor BPEL component performance in composites.
Expend the composite-->Components-->BPEL, Hit ****inProcess
This page, shows performance overview of this BPEL process.
13. Right click BPEL process and choose Display Functional View
14 Display Functional View provide the perforamnce information for each activity within BPEL process.
Tuesday, October 18, 2011
Monday, October 17, 2011
How to Deploy ADP Manager, ADP agent, JVM Diagnostics Manager and JVM Agent in Enterprise Manager Cloud Control 12C
This blog will deal with what is ADP and how to deploy ADP Manager, ADP agent, JVM Diagnostics Manager and JVM Agent in Enterprise Manager Cloud Control 12c.
Check job activity status until all activities are changed to succeeded, like below:
Then login admin console and double check new managed server EMGC_ADPMANAGER1 is created and up.
Hit Weblogic Domain where you want to deploy ADP agent
In the Weblogic Domain page, hit Menu Weblogic Domain-->Diagnostics-->Setup Diagnostics Agents
On Deploy Diagnostics Agents page, choose managed servers to which you want to install diagnostics agents and privode the required credentials then Hit Deploy
If you hit the error that ls: /oracle/agent12c/core/12.1.0.1.0/sysman/jlib/wlfullclient.jar: No such file or directory
Please do the below:
enter <WEBLOGIC_HOME>/server/lib
Check the job activity status and make sure it's succeeded
Hit Deploy JVM Diagnostics Manager
Fill the required information and hit Deploy
Monitor job activity status is succeeded.
Hit Targets-->Fusion middlware-->Your Oracle Weblogic Domain
Hit Menu Weblogic Domain-->Diagnostics-->Setup Diagnostics Agent
Choose the managed server to which you want to deploy and filled credentials,then hit Deploy.
Check job activity status and make sure it's succeeded.
After deploy agent, make sure you bounce the monitored target servers
- Application Manager Performance (ADP)
The Application Dependency and Performance (ADP) pages within Enterprise Manager Cloud Control analyze Java EE, SOA, and Portal applications to capture the complex relationships among various application building blocks in its Application Schema model - the core of the Oracle intelligent platform.Using ADP you can:- Monitor performance of the following applications:
- Oracle SOA Suite 11g
- Oracle Service Bus (OSB)
- Java EE
- WebLogic Portal
- WebCenter
- Have visibility into components defined by way of metadata within a framework (for example, components within a composite) with deep dive visibility, where available
- View static relationships defined between components and services, such as OSB business and proxy services, and SOA services and references
Oracle Document Regarding ADP Manager:
Oracle® Enterprise Manager Cloud Control Getting Started with Oracle Fusion Middleware Management
12c Release 1 (12.1.0.1)
Part Number E24215-01
Section: 14 Introduction to Application Dependency and Performance
URL: http://download.oracle.com/docs/cd/E24628_01/install.121/e24215/intro.htm
- Monitor performance of the following applications:
- Deploy ADP Diagnostics Manager
login em console
hit Setup-->Middleware Diagnostics
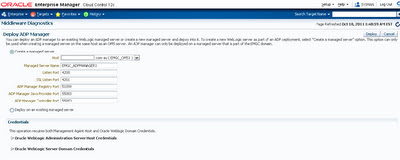
Hit Deploy ADP Manager
Fill the required information and hit Deploy
Fill the required information and hit Deploy
Check job activity status until all activities are changed to succeeded, like below:
Then login admin console and double check new managed server EMGC_ADPMANAGER1 is created and up.
- Deploy ADP Agent
Hit Weblogic Domain where you want to deploy ADP agent
In the Weblogic Domain page, hit Menu Weblogic Domain-->Diagnostics-->Setup Diagnostics Agents
On Deploy Diagnostics Agents page, choose managed servers to which you want to install diagnostics agents and privode the required credentials then Hit Deploy
If you hit the error that ls: /oracle/agent12c/core/12.1.0.1.0/sysman/jlib/wlfullclient.jar: No such file or directory
Please do the below:
enter <WEBLOGIC_HOME>/server/lib
java -jar wljarbuilder.jar --> generate wlfullclient.jarthen copy wlfullclient.jar to /oracle/agent12c/core/12.1.0.1.0/sysman/jlib/
Check the job activity status and make sure it's succeeded
- Deploy JVM Diagnostics Managers
Hit Deploy JVM Diagnostics Manager
Fill the required information and hit Deploy
Monitor job activity status is succeeded.
- Deploy JVM Agent
Hit Targets-->Fusion middlware-->Your Oracle Weblogic Domain
Hit Menu Weblogic Domain-->Diagnostics-->Setup Diagnostics Agent
Choose the managed server to which you want to deploy and filled credentials,then hit Deploy.
Check job activity status and make sure it's succeeded.
After deploy agent, make sure you bounce the monitored target servers
- Verify ADP and JVM Manager Installation
Hit Setup menu-->Middleware Diagnostics.
On the Middleware Diagnostics page, the newly deployed ADP and JVMD Manager must appear and its status must be up and running.
- Verify ADP Agent and JVM Agent Installation
Hit Targets menu-->Middleware.
Hit Menu Middleware Features-->Application Dependency and Performance.
On the Monitoring tab, expand the folder corresponding to the ADP Manager associated with the deployed agents.
Select the Status and click the node, do not expand it. Verify the Agent Information table for the servers that you deployed to.
Sunday, October 16, 2011
Enterprise Manager Cloud Control 12c -- Monitor soa-infra 11.1.1.5
Purpose
This blog provide how to monitor soa-infra 11.1.1.5 by Enterprise Manager Cloud Control 12c.How to Monitor soa-infra 11.1.1.5
- Make sure agent is up
Login em console
Hit Setup-->Agent
Make sure agents installed on monitored targets are up.
Or you can use the below command to check agent status:
/AgentInstallPath/agent_inst/bin/emctl status agent
The output is similar like below:
Subscribe to:
Comments (Atom)


